




Kenya’s optical healthcare market is growing, but the most important story is not simply growth. The Kenya Optical Industry Report for Full Year 2025, released by Smart Applications International in partnership with the Kenya Association of Opticians, shows how utilisation, geography, age and diagnosis are shaping optical healthcare demand and expenditure across the country.
The report draws on claims data covering 2,081 active optical providers and 186,357 unique patients nationwide. For hospitals, insurers and healthcare decision-makers, the findings provide a practical view of where optical benefits are being used, where costs are concentrated and where better data could support more targeted benefit design.
| At a glance KES 3.14 billion in optical spend | 213,465 visits | 255,255 claims | 186,357 unique patients | 2,081 active providers | KES 14.53K average cost per visit |
1. Optical spending reached KES 3.14 billion in 2025
Optical spend reached KES 3.14 billion in 2025, representing a 4.95% year-on-year increase. At the same time, optical visits rose 5.14% to 213,465, while 255,255 claims were processed.
The relationship between these figures is particularly important. Average cost per visit remained broadly stable at KES 14.53K, up just 0.69%. In other words, the increase in spending appears to be driven primarily by greater utilization rather than a significant increase in the unit cost of care.
Read More: Women’s Health in Kenya: What 1.4 Million Healthcare Visits Reveal About Changing Health Trends
For insurers and providers, this distinction matters. If utilization continues to expand while average cost per visit remains relatively stable, the next phase of optical cost management is less about suppressing unit prices and more about understanding who is using the benefit, where they are accessing care and what conditions are driving demand.
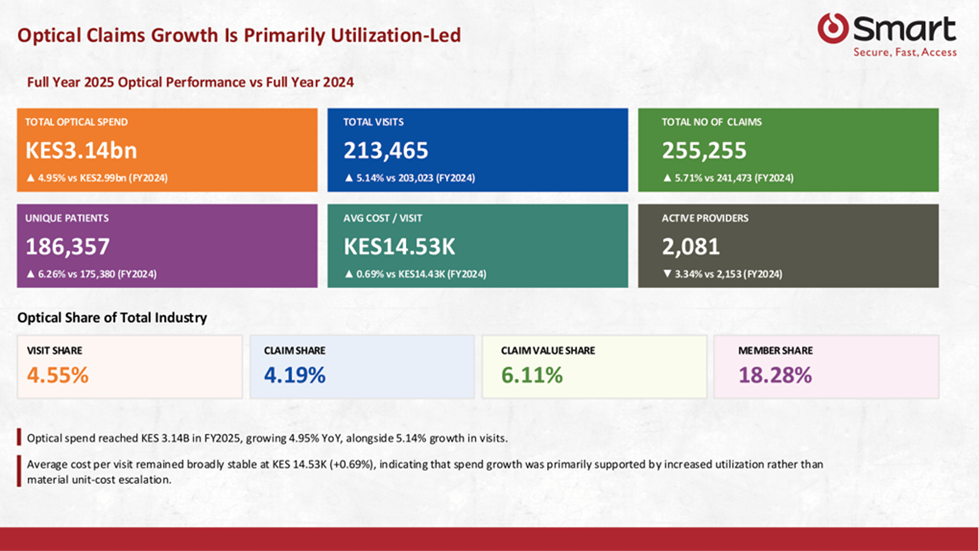
The report’s headline utilization and cost metrics for 2025.
2. Optical has broad reach, but repeat engagement remains shallow
Optical care reached 18.28% of the insured membership base in 2025. That indicates meaningful penetration of the benefit across the insured population. Yet the frequency pattern tells a more nuanced story: 88.2% of optical users visited only once during the year.
This creates an important benefit-design question. Optical care is reaching a significant share of members, but most users are engaging with the benefit only once. For insurers and employers, that suggests the benefit may be serving episodic needs, such as routine optical assessment, refractive correction or eyewear-related needs, rather than generating frequent repeat utilisation.
The distinction is valuable for forecasting. A benefit with wide reach and low repeat utilisation behaves differently from one with a smaller user base but high frequency. Understanding that utilisation pattern can help organisations model future demand more accurately.
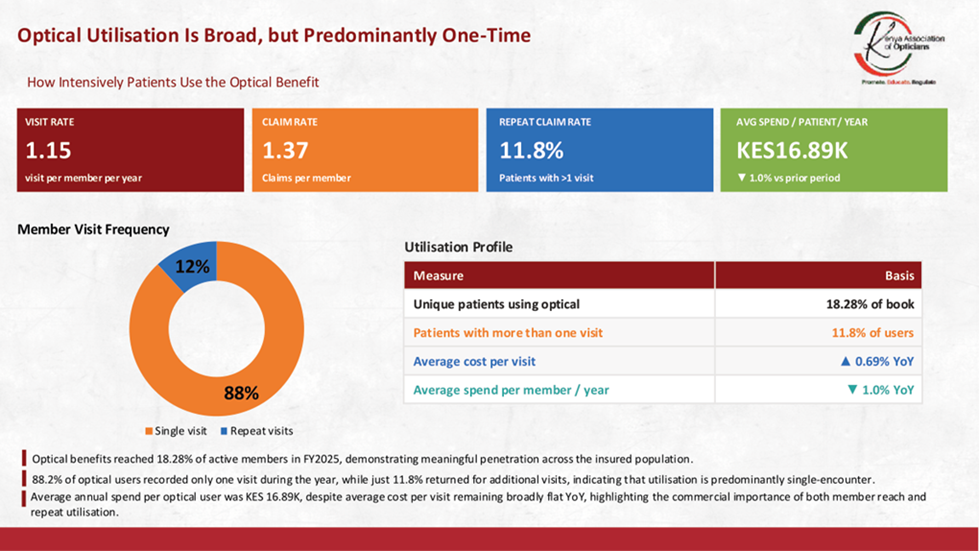
Utilisation frequency and the predominance of one-time optical users.
3. Nairobi dominates optical demand and revenue
The geographic distribution of optical utilisation is one of the report’s clearest findings. Nairobi accounted for 57.8% of optical visits and 62.0% of optical revenue. Mombasa followed at 5.4% of visits, while no other county crossed 4.3% of visits.
The concentration is significant because it points to a structural access and provider-distribution story. Kenya has a nationwide optical provider network, yet utilisation and revenue remain heavily concentrated in the capital.
For healthcare leaders, geography therefore becomes more than a reporting dimension. It can inform provider-network planning, member access strategies and the design of optical benefits that reflect differences in local availability.
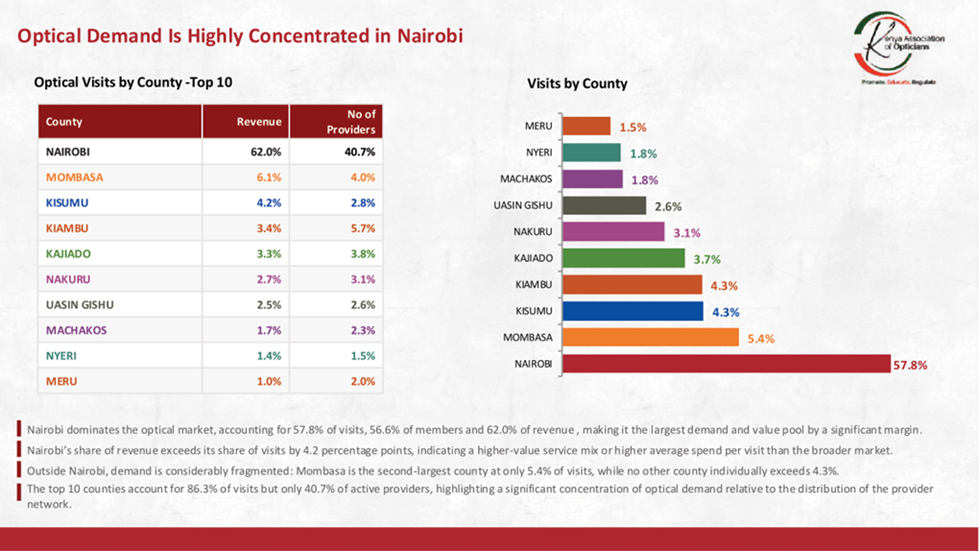
County-level distribution of optical visits and revenue.
4. Working-age adults are the commercial core of optical demand
Adults aged 21 to 50 accounted for 68.4% of optical visits in 2025, making working-age adults the clear commercial core of the benefit.
This concentration has implications for employers, insurers and healthcare providers. Optical benefits are reaching a population segment that is economically active and likely to intersect with employer-sponsored and insured healthcare schemes. Benefit design, communication and provider access can therefore be evaluated against the needs of this large user group.
At the same time, the report shows that cost per visit rises steadily with age. The average cost increases from KES 9.36K among children to KES 35.06K for patients aged 71 to 80.
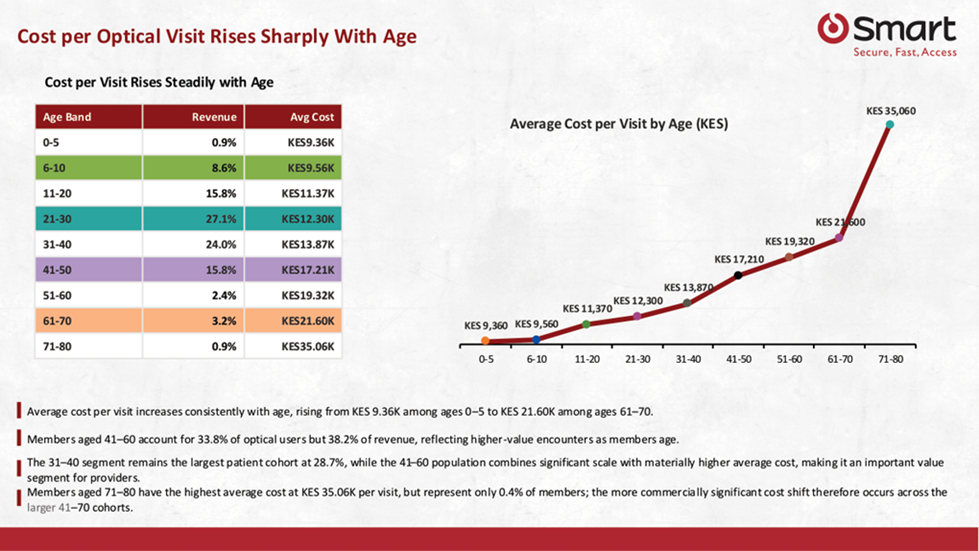
Average optical cost per visit rises sharply with age.
| What this means for benefit design Utilisation volume and cost exposure do not sit evenly across age groups. A strategy that looks only at the number of visits can miss the increasing financial weight of older patients. |
5. Refractive errors drive more than half of optical visits
Myopia, astigmatism and presbyopia together accounted for 53.9% of optical visits in 2025. The report therefore places refractive error at the centre of optical demand.
Myopia accounted for 20.9% of visits, followed by astigmatism at 17.3% and presbyopia at 15.7%. Presbyopia also recorded the highest average cost per case among the highlighted diagnoses in the report.
Read More: SmartHealth+: Enabling Cashless Payments, eTIMS-Compliant Billing for Healthcare Facilities
The diagnosis mix provides another lens through which insurers and providers can interpret optical utilisation. Rather than treating all optical claims as a single category, decision-makers can segment demand by condition, age and utilisation pattern to understand where the greatest clinical and financial concentration sits.
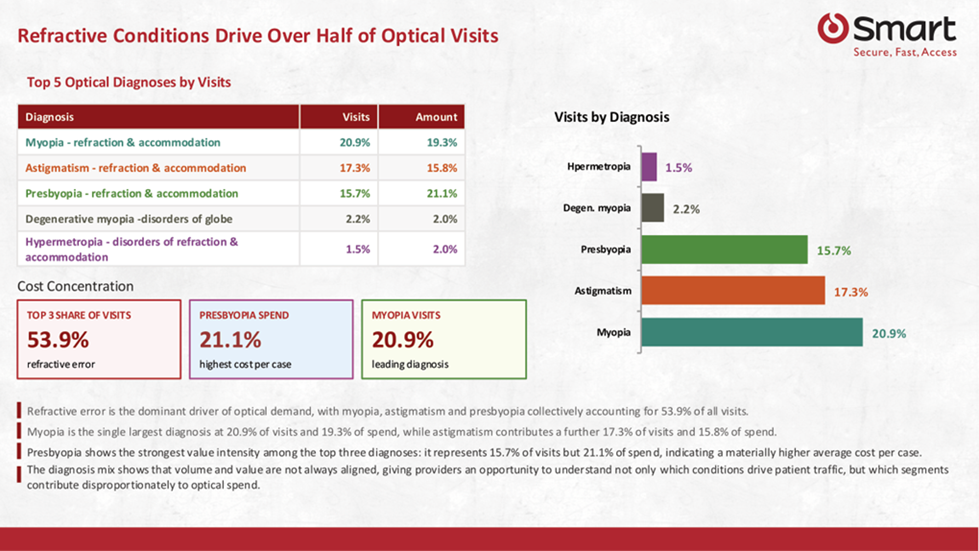
Top refractive diagnoses account for 53.9% of optical visits.
6. Inpatient optical care is a small-volume, high-cost outlier
One of the most important cost signals in the report is the difference between optical inpatient and outpatient care. Inpatient optical care represented approximately 1% of visits but 5% of total optical spend.
The average inpatient optical cost was KES 91,460 per visit — more than seven times the outpatient average. Although inpatient utilisation is small relative to overall optical demand, its financial intensity makes it a category worth monitoring separately.
This is a good example of why claims analysis should look beyond utilisation volume. A low-frequency category can still carry disproportionate cost exposure. For benefit managers, separating frequency from severity can reveal cost drivers that a simple visit-count dashboard might miss.
7. What the 2025 data means for insurers and providers
Taken together, the findings point toward a more data-led approach to optical benefit management. The report’s opportunity areas can be summarised in five practical themes:
1. Manage cost through utilisation intelligence: With average cost per visit broadly stable, understanding utilisation patterns may be more valuable than focusing only on unit-price inflation.
2. Plan around geographic concentration: Nairobi’s dominant share of visits and revenue highlights the importance of provider-network coverage and access outside the capital.
3. Segment by age and value: The rise in cost per visit with age means patient mix can materially influence financial exposure even when overall utilisation changes modestly.
4. Understand diagnosis-level demand: Refractive conditions account for more than half of visits, creating a clear basis for more granular analysis of clinical and benefit needs.
5. Monitor high-cost outliers: Inpatient optical care demonstrates why low-frequency services should still be tracked closely when their cost intensity is substantially higher.
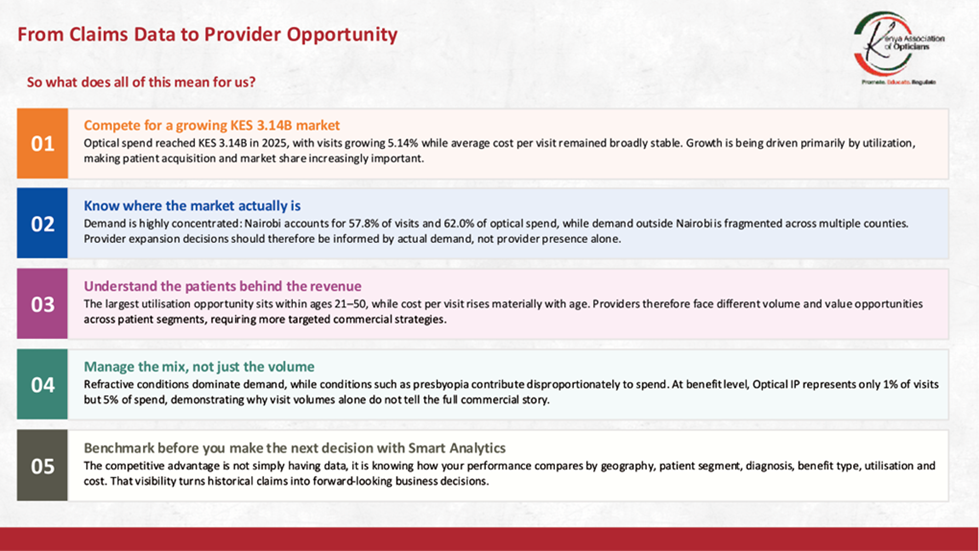
The report translates claims intelligence into provider and benefit-management opportunities.
Conclusion: The next competitive edge is better optical data
The Kenya Optical Industry Report 2025 shows an expanding optical market, but unevenly. Spending increased as utilisation grew, while average cost per visit remained broadly stable. Demand is concentrated geographically in Nairobi, commercially concentrated among adults aged 21 to 50, and clinically driven by refractive conditions.
At the same time, the steep rise in cost per visit among older patients and the disproportionate spend on inpatient optical care show why aggregate utilisation figures are not enough.
For hospitals, insurers and healthcare leaders, the opportunity is to move from simply measuring optical claims to using claims intelligence to anticipate demand, understand member behaviour, optimise provider networks and design benefits around real utilisation patterns.
The organisations that gain the strongest advantage in the next phase of optical healthcare will be those that treat the data as a strategic asset, before utilisation patterns become cost problems.
Source and editorial note
This article is based on the Kenya Optical Industry Report, Full Year 2025 (January–December 2025), produced by Smart Applications International in partnership with the Kenya Association of Opticians. The article preserves the report’s figures and framing and is intended as an SEO-optimized editorial version for digital publication.